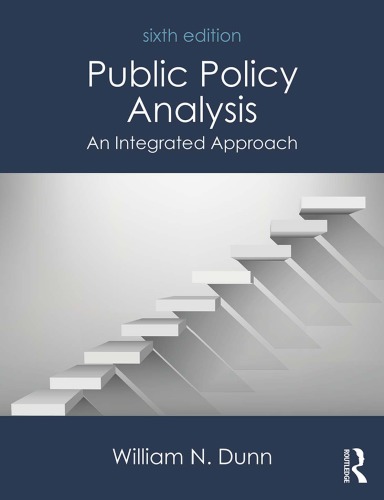
Public Policy Analysis An Integrated Approach 1st edition by William Dunn 1351721684 9781351721684
$50.00 Original price was: $50.00.$25.00Current price is: $25.00.
Public Policy Analysis: An Integrated Approach 1st edition by William N. Dunn – Ebook PDF Instant Download/DeliveryISBN: 1351721684, 9781351721684
Full download Public Policy Analysis: An Integrated Approach 1st edition after payment.
Product details:
ISBN-10 : 1351721684
ISBN-13 : 9781351721684
Author: William N. Dunn
Public Policy Analysis, the most widely cited book on the subject, provides students with a comprehensive methodology of policy analysis. It starts from the premise that policy analysis is an applied social science discipline designed for solving practical problems facing public and nonprofit organizations. This thoroughly revised sixth edition contains a number of important updates: Each chapter includes an all-new “big ideas” case study in policy analysis to stimulate student interest in timely and important problems. The dedicated chapter on evidence-based policy and the role of field experiments has been thoroughly rewritten and expanded. New sections on important developments in the field have been added, including using scientific evidence in public policymaking, systematic reviews, meta-analyses, and “big data.” Data sets to apply analytical techniques are included online as IBM SPSS 23.0 files and are convertible to Excel, Stata, and R statistical software programs to suit a variety of course needs and teaching styles. All-new PowerPoint slides are included to make instructor preparation easier than ever before. Designed to prepare students from a variety of academic backgrounds to conduct policy analysis on their own, without requiring a background in microeconomics, Public Policy Analysis, Sixth Edition helps students develop the practical skills needed to communicate findings through memos, position papers, and other forms of structured analytical writing. The text engages students by challenging them to critically analyze the arguments of policy practitioners as well as political scientists, economists, and political philosophers.
Public Policy Analysis: An Integrated Approach 1st Table of contents:
Part I Methodology of Policy Analysis
Chapter 1 The Process of Policy Analysis
Learning Objectives
Introduction
Methodology of Policy Inquiry
Multidisciplinary Policy Analysis
Policy-Relevant Knowledge
Figure 1.1 Multidisciplinary Policy Analysis
Knowledge Transformations
Policy-Analytic Methods
Forms of Policy Analysis
Prospective and Retrospective Analysis
Figure 1.2 Forms of Policy Analysis
Descriptive and Normative Analysis
Problem Structuring and Problem Solving
Integrated and Segmented Analysis
The Practice of Policy Analysis
Reconstructed Logic versus Logic-in-Use
Methodological Opportunity Costs
Figure 1.3 Opportunity Costs of Using Multiple Methods
Critical Thinking and Public Policy
The Structure of Policy Arguments
Figure 1.4 Elements of a Policy Argument
Chapter Summary
Review Questions
Demonstration Exercises
Bibliography
Case 1.1 The Goeller Scorecard and Technological Change
Table C1.1 Scorecard
Case 1.2 Using Influence Diagrams and Decision Trees to Structure Problems of Energy and Highway Safety Policy
Figure C1.2.1 Influence Diagram and Decision Tree
Case 1.3 Mapping International Security and Energy Crises
Figure C1.3.1 Simple Argument Maps Are Static and Uncontested
Figure C1.3.2 Complex Argument Maps Are Dynamic and Contested
Chapter 2 Policy Analysis in the Policymaking Process
Learning Objectives
Introduction
The Historical Context
Early Origins
The Nineteenth-Century Transformation
Twentieth-Century Professionalization
The Era of Evidence-Based Policy
The Policymaking Process
Table 2.1 Phases of the Policymaking Process
Figure 2.1 Complexity, Feedback, and Short Circuiting in the Policymaking Process
Models of Policy Change
The Comprehensive Rationality Model
Second-Best Rationality
Table 2.2 The Voters’ Paradox
Disjointed Incrementalism
Bounded Rationality
Erotetic Rationality
Simultaneous Convergence
Punctuated Equilibrium
Policy Analysis in the Policymaking Process
Potential Uses of Analysis
Figure 2.2 Policy-Relevant Knowledge and Associated Methods
Uses of Analysis in Practice
Chapter Summary
Review Questions
Demonstration Exercises
Bibliography
Case 2.1 Are Policy Analysts Technocrats?
Case 2.2 Monitoring the Uses of Policy Analysis
Part II Methods of Policy Analysis
Chapter 3 Structuring Policy Problems
Learning Objectives
Introduction
Nature of Policy Problems
Problem Solving versus Problem Structuring
Figure 3.1 The Process of Problem Structuring
Characteristics of Problems
Problems versus Issues
Figure 3.2 Hierarchy of Types of Policy Issues
Three Classes of Policy Problems
Table 3.1 Differences in the Structure of Three Classes of Policy Problems
Problem Structuring in Policy Analysis
Creativity in Problem Structuring
Phases of Problem Structuring
Figure 3.3 Phases of Problem Structuring
Errors of the Third Type (EIII)
Policy Models and Problem Structuring
Descriptive Models
Normative Models
Verbal Models
Symbolic Models
Procedural Models
Figure 3.4 A Symbolic Model
Figure 3.5 Simulation or Procedural Model
Models as Surrogates and Perspectives
Figure 3.6 Assumed Effects of X on Y from One Perspective
Figure 3.7 Map of Transportation Points in Central Region
Figure 3.8 Solution for Nine-Dot Problem
Methods of Problem Structuring
Boundary Analysis
Table 3.2 Characteristics of Methods of Problem Structuring
Figure 3.9 Pareto Chart—Estimated Boundary of Problem
Classification Analysis
Table 3.3 Percent of Persons Living below the Poverty Level by Age Group, 1970–2014
Figure 3.10 Set Union
Figure 3.11 Set Intersection
Figure 3.12 Classification Scheme
Figure 3.13 Cross break
Hierarchy Analysis
Figure 3.14 Hierarchy Analysis of the Causes of Fires
Synectics
Brainstorming
Multiple Perspective Analysis
Assumptional Analysis
Figure 3.15 The Process of Assumptional Analysis
Argument Mapping
Figure 3.16 Plausibility and Importance of Warrant about Opportunity Costs of Driving at Lower Speeds
Chapter Summary
Review Questions
Demonstration Exercises
Bibliography
Exhibit 3.1 Policy Stakeholder Analysis: The Affordable Care Act (Obamacare)
Case 3.1 Structuring Problems of Risk: Safety in Mines and on Highways
Figure C3.1 Pareto Chart—Cumulative Frequency of Rival Causes
Figure C3.2 Pareto Chart—Cumulative Frequency of Criteria for Evaluating Research on Risk
Case 3.2 Brainstorming across Disciplines: The Elevator Problem
Chapter 4 Forecasting Expected Policy Outcomes
Learning Objectives
Introduction
Forecasting in Policy Analysis
The Value of Forecasting
Figure 4.1 Processes of Intuition (System I) and Reasoning (System II)
Limitations of Forecasting
Societal Futures
Figure 4.2 Three Types of Societal Futures: Potential, Plausible, and Normative
Approaches to Forecasting
Aims and Bases of Forecasts
Figure 4.3 The Logic of Trend Extrapolation: Inductive Reasoning
Figure 4.4 The Logic of Theoretical Prediction: Deductive Reasoning
Figure 4.5 The Logic of Possible Futures: Abductive Reasoning
Choosing Methods and Techniques
Table 4.1 Three Approaches to Forecasting
Extrapolative Forecasting
Classical Time-Series Analysis
Figure 4.6 Demonstration of a Secular Trend: Total Arrests per 1,000 Persons in Chicago, 1940–1970
Figure 4.7 Demonstration of Cyclical Fluctuations: Total Arrests per 1,000 Persons in Chicago, 1868–1970
Linear Trend Estimation
Figure 4.8 Two Properties of Linear Regression
Table 4.2 Time-Series Data on Total Energy Consumption Used in Linear Regression
Table 4.3 Linear Regression with an Even-Numbered Series
Exhibit 4.1 SPSS Output for Tables 4.2 and 4.3
Nonlinear Time Series
Figure 4.9 Five Classes of Nonlinear Time Series
Figure 4.10 Growth of Federal Government Organizations in the United States by Presidential Term, 1789–1973
Figure 4.11 Linear versus Growth Trends
Exponential Weighting
Data Transformation
Table 4.4 Square Root and Logarithm of a Time Series Exhibiting Rapid Growth
Catastrophe Methodology
Table 4.5 Linear Regression with Logarithmic Transformation of Time Series
Theoretical Forecasting
Theory Mapping
Figure 4.12 Four Types of Causal Arguments
Figure 4.13 Arrow Diagram Illustrating the Causal Structure of an Argument
Theoretical Modeling
Causal Modeling
Figure 4.14 Path Diagram Illustrating a Model of Public Choice Theory
Regression Analysis
Figure 4.15 Scatterplot Illustrating Different Patterns and Relations between Hypothetical Annual Maintenance Costs and Annual Mileage per Vehicle
Table 4.6 Worksheet for Estimating Future Maintenance Costs from Annual Mileage per Vehicle
Point and Interval Estimation
Table 4.7 Calculation of Standard Error of Estimated Maintenance Costs
Correlational Analysis
Exhibit 4.2 SPSS Output for Table 4.7
Judgmental Forecasting
The Delphi Technique
Table 4.8 Types of Items and Scales Used in a Policy Delphi Questionnaire
Table 4.9 Hypothetical Responses in First-Round Policy Delphi: Desirability and Feasibility of Drug-Control Objectives
Cross-Impact Analysis
Table 4.10 Cross-Impact Matrix Illustrating Consequences of Mass Automobile Use
Table 4.11 Hypothetical Illustration of the First Round (Play) in a Cross-Impact Matrix
Feasibility Forecasting
Table 4.12 Feasibility Assessment of Two Fiscal Policy Alternatives
Evidence-Based Forecasting
Table 4.13 Recommendations for Evidence-Based Forecasting
Chapter Summary
Review Questions
Demonstration Exercises
Bibliography
Case 4.1 Visual Signatures in Regression Analysis: The Anscombe Quartet
Figure C4.1.1 The Anscombe Quartet
Case 4.2 Forecasting MARTA Receipts
Table C4.2.1 MARTA Receipts, 1973–2014
Case 4.3 Multimethod Forecasting: Syria Chemical Weapons
Figure C4.3.1 Multimethod Forecast of Chemical Weapons in Syria
Chapter 5 Prescribing Preferred Policies
Learning Objectives
Introduction
Prescription in Policy Analysis
Prescription and Policy Advocacy
A Simple Model of Choice
Box 5.1 The Over-Advocacy Trap
A Complex Model of Choice
Table 5.1 Transitive and Intransitive Preferences
Forms of Rationality
Criteria for Policy Prescription
Table 5.2 Criteria of Adequacy: Four Types of Problems
Figure 5.1 Cost–effectiveness comparisons using four criteria of adequacy
Figure 5.2 Income Inequality: Percentage Share of Top 10 Percent of U.S. and European Households in National Income, 1900–2010
Table 5.3 Comparison of Benefit–Cost Ratio and Net Benefits as Criteria of Adequacy (in Thousands of Dollars)
Approaches to Prescription
Public versus Private Choice
Figure 5.3 Three Types of Goods in the Public and Private Sectors
Supply and Demand
Figure 5.4 Supply and Demand Curves and the Equilibrium Price–Quantity Combination
Public Choice
Cost–Benefit Analysis
Types of Costs and Benefits
Figure 5.5 Classification of Costs and Benefits According to Four Types of Questions
Tasks in Cost–Benefit Analysis
Table 5.4 Contrasts between Goals and Objectives
Table 5.5 Ten Tasks in Conducting a Cost–Benefit Analysis
Cost–Effectiveness Analysis
Methods of Prescription
Table 5.6 Methods of Prescription
Objectives Mapping
Figure 5.6 Objectives Tree for National Energy Policy
Values Clarification
Values Critique
Figure 5.7 Value-Critical Discourse
Cost Element Structuring
Table 5.7 Cost Element Structure
Figure 5.8 Simplified Partial Cost Model for Total Initial Investment
Cost Estimation
Shadow Pricing
Constraints Mapping
Cost Internalization
Figure 5.9 Constraints Map for National Energy Policy
Discounting
Table 5.8 Internal, External, and Total Costs of Maternal Care
Figure 5.10 Comparison of Discounted and Undiscounted Costs Cumulated for Two Programs with Equal Effectiveness
Table 5.9 Calculation of Present Value of Cost Stream at 10 Percent Discount Rate over 5 Years (in Millions of Dollars)
Sensitivity Analysis
Plausibility Analysis
Table 5.10 Sensitivity Analysis of Gasoline Prices on Costs of Training Programs
Figure 5.11 Threats to the Plausibility of Claims about the Benefits of the 55 mph Speed Limit
Chapter Summary
Review Questions
Demonstration Exercises
Bibliography
Case 5.1 The Spreadsheet and Scorecard—Evaluating Benefits and Costs of Energy Policies
Table C5.1 Scorecard and Spreadsheet
Case 5.2 Opportunity Costs of Saving Lives—The 55 mph Speed Limit
Table C5.2 Analysis of the Costs and Benefits of the 55 mph Speed Limit
Chapter 6 Monitoring Observed Policy Outcomes
Learning Objectives
Introduction
Monitoring in Policy Analysis
Sources of Information
Policy-Relevant Causes and Effects
Figure 6.1 Causal Mechanism: Inputs, Activities, Outputs, Outcomes, and Impacts
Definitions and Indicators
Table 6.1 Inputs, Activities, Outputs, Outcomes, and Impacts in Three Issue Areas
Approaches to Monitoring
Table 6.2 Contrasts among Six Approaches to Monitoring
Social Systems Accounting
Table 6.3 Some Representative Social Indicators
Policy Experimentation
Social Auditing
Research and Practice Synthesis
Table 6.4 Sample Case-Coding Scheme: Representative Indicators and Coding Categories
Table 6.5 Research Survey Method: Empirical Generalizations, Action Guidelines, and Levels of Confidence in Generalizations
Systematic Reviews and Meta-Analyses
Figure 6.2 Steps in Conducting a Systematic Review or Meta-Analysis
Methods for Monitoring
Table 6.6 Methods Appropriate to Five Approaches to Monitoring
Graphic Displays
Figure 6.3 Two Graphic Displays of Motor Vehicle Deaths
Figure 6.4 Spurious and Plausible Interpretations of Data
Figure 6.5 Bar Graph Showing Municipal Personnel Costs Per Capita for Cities with Growing and Declining Populations and for New York City
Table 6.7 Grouped Frequency Distribution: Number of Persons below the Poverty Threshold by Age Group in 1977
Figure 6.6 Histogram and Frequency Polygon: Number of Persons below the Poverty Threshold by Age Group in 1977
Figure 6.7 Lorenz Curve Showing the Distribution of Family Personal Income in the United States in 1975 and 1989
The Gini Index
Table 6.8 Computation of Gini Concentration Ratio for Violent Crimes Known to Police per 100,000 Persons in 1976
Tabular Displays
Index Numbers
Table 6.9 Poverty Rates in 1968, 1990, and 2006 by Age and Race
Table 6.10 Number of Drunk Driving Re-arrests in Treatment and Control Groups
Table 6.11 Use of Consumer Price Index (1982–1984 = 100) to Compute Purchasing Power Index
Table 6.12 Real Weekly Wages in the U.S., 2001–2010
Table 6.13 Maximum Concentration of Pollutants Reported in Chicago, Philadelphia, and San Francisco for Averaging Times of 5 Minutes and 1 Year
Table 6.14 Implicitly Weighted Aggregative Quantity Index to Measure Changes in Pollutants in the United States, 1970–1975
Table 6.15 Duration of Exposure to Pollutants and Consequent Damage to Health and the Environment
Effect Sizes
Table 6.16 Calculation of Odds-Ratio (Using Data from Table 6.10)
Table 6.17 Calculation of Binary Effect Size Display (BESD) and Risk-Ratio (R-R)
Table 6.18 Calculation of Standardized Mean Difference (Cohen’s d)
Interrupted Time-Series Analysis
Figure 6.8 Interrupted Time Series Showing Effects and No Effects
Figure 6.9 Connecticut Traffic Deaths before and after the 1956 Crackdown on Speeding
Figure 6.10 Extended Time-Series Graph
Figure 6.11 Control-Series Graph
Figure 6.12 Threats to Validity as Objections to the Argument That the Speeding Crackdown Was Worthwhile
Regression-Discontinuity Analysis
Table 6.19 Worksheet for Regression and Correlation: Investment in Training Programs and Subsequent Employment of Trainees
Exhibit 6.1 SPSS Output for Table 6.19
Figure 6.13 Tie-Breaking Experiment
Table 6.20 Distribution of Cities by Scores on a Hypothetical Index of Pollution Severity
Table 6.21 Results of Regression-Discontinuity Analysis for Hypothetical Experimental and Control Cities
Exhibit 6.2 SPSS Output for Tables 6.13 and 6.14
Figure 6.14 Results of Regression-Discontinuity Analysis
Chapter Summary
Review Questions
Table 6.22 Crimes Committed in the United States: Offenses Known to Police per 100,000 Persons, 1985–2009
Table 6.23 Murders in New York City, 1985–2009
Table 6.24 Percentage Distribution of Family Personal Income in the United States by Quintiles, 1975, 1989, 2006, 2015
Demonstration Exercise
Bibliography
Case 6.1 Monitoring Policy Outcomes: The Political Economy of Traffic Fatalities in Europe and the United States
Exhibit C6.1 Fatalities and Other Variables in the United States, 1966–2015
Exhibit C6.2 Fatalities per 100,000 Persons, 1970–1976
Chapter 7 Evaluating Policy Performance
Learning Objectives
Introduction
Ethics and Values in Policy Analysis
Thinking about Values
Ethics and Meta-ethics
Standards of Conduct
Descriptive Ethics, Normative Ethics, and Meta-ethics
Descriptive Value Typologies
Table 7.1 Basic Value Typology: Terminal and Instrumental Values
Developmental Value Typologies
Normative Theories
Meta-ethical Theories
Evaluation in Policy Analysis
The Nature of Evaluation
Functions of Evaluation
Criteria for Policy Evaluation
Table 7.2 Criteria for Evaluation
Approaches to Evaluation
Table 7.3 Three Approaches to Evaluation
Pseudo-evaluation
Formal Evaluation
Varieties of Formal Evaluation
Table 7.4 Types of Formal Evaluation
Decision-Theoretic Evaluation
Methods for Evaluation
Table 7.5 Techniques for Evaluation by Three Approaches
Table 7.6 Interview Protocol for User-Survey Analysis
Chapter Summary
Review Questions
Demonstration Exercise
Bibliography
Case 7.1 The Ethics of Cake Cutting
Case 7.2 The Economics of Morality: Evaluating Living Wage Policies
Table C7.2.1 Hourly Wages
Table C7.2.2 Monthly Expenses
Part III Methods of Policy Communication
Chapter 8 Developing Policy Arguments
Learning Objectives
Introduction
The Structure of Policy Arguments
Figure 8.1 Structure of a Policy Argument
Types of Knowledge Claims
Policy Maps
Figure 8.2 Argument Map—Privatizing Transportation
Exhibit 8.1 Identifying and Arranging Elements of a Policy Argument
Modes of Policy Argumentation
Argumentation from Authority
Table 8.1 Modes of Policy Argumentation with Reasoning Patterns
Argumentation from Method
Figure 8.3 Argumentation from Authority—Unintended Consequences of the U.S.–NATO Attack on Serbia
Figure 8.4 Argumentation from Method—Intransitivity of Preferences for Nuclear Power
Argumentation from Generalization
Figure 8.5 Argumentation from Generalization—A “False Positive” About the Success of Community Nutrition
Argumentation from Classification
Figure 8.6 Argumentation from Classification—Challenging Claims about Authoritarian Rule and Terrorism
Argumentation from Cause
Figure 8.7 Argumentation from Theoretical Cause—Competing Deductive-Nomological Explanations of the Cuban Missile Crisis
Figure 8.8 Argumentation from Practical Cause—Rival Explanations of the Effects of the Connecticut Crackdown on Speeding
Argumentation from Sign
Figure 8.9 Argumentation from Sign—Quantitative Indicators Such as Correlation Coefficients and P-Values Do Not “Prove” Causation
Argumentation from Motivation
Figure 8.10 Argumentation from Motivation—Support for the Equal Rights Amendment
Argumentation from Intuition
Argumentation from Analogy
Figure 8.11 Argumentation from Intuition—A Counterintuitive Solution Avoids Certain Death
Figure 8.12 Argumentation from Analogy—The Equal Rights Amendment and False Analogy
Argumentation from Parallel Case
Figure 8.13 Argumentation from Parallel Case—The Dutch Model and False Parallel
Argumentation from Ethics
Figure 8.14 Argumentation from Ethics—Income Distribution and Justice as Fairness
Evaluating Policy Arguments
Some Hermeneutic Guidelines
Exhibit 8.2 Guidelines for Interpreting Arguments
Guidelines from Informal and Formal Logic
Table 8.2 Guidelines for Identifying Invalid Arguments and Fallacies
Chapter Summary
Review Questions
Demonstration Exercises
Bibliography
Case 8.1 Pros and Cons of Balkan Intervention
Case 8.2 Images, Arguments, and the Second Persian Gulf Crisis, 1990–1991
Figure C8.2.1 Senate Arguments Supporting and Opposing U.S. Involvement under Security Council Resolution 678 Authorizing Military Intervention to Force the Withdrawal of Iraq from Kuwait (November 29, 1990)
Chapter 9 Communicating Policy Analysis
Learning Objectives
Introduction
The Process of Policy Communication
Box 9.1 Producing Policy Analysis—A Poorly Managed Lumber Mill
Figure 9.1 The Process of Policy Communication
Tasks in Policy Documentation
Tasks in Oral Presentations and Briefings
Box 9.2 Contingent Communication
The Policy Issue Paper
Issues Addressed in the Policy Issue Paper
Table 9.1 Two Kinds of Policy Disciplines
Elements of the Policy Issue Paper
The Policy Memorandum
The Executive Summary
The Letter of Transmittal
Figure 9.2 Methods for Developing a Policy Memo or Issue Paper
Planning the Oral Briefing and Visual Displays
Policy Analysis in the Policymaking Process
Perceived Quality of Information
Perceived Quality of Methods
Complexity of Problems
Political and Organizational Constraints
Interactions among Policymakers and Other Stakeholders
Chapter Summary
Review Questions
Demonstration Exercises
Box 9.3 Checklist for an Oral Briefing
Bibliography
Case 9.1 Translating Policy Arguments into Issue Papers, Position Papers, and Letters to the Editor—The Case of the Second Persian Gulf War
Figure C9.1.1 Sample Argument Map
Figure C9.1.2 Argument Map for a Position Paper
Figure C9.1.3 Argument Map for Policy Brief on the Invasion of Iraq
Figure C9.1.4 Argument Map for a Policy Issue Paper or Policy Memo on the Invasion of Iraq
Figure C9.1.5 Argument Map for a Letter to the Editor
Case 9.2 Communicating Complex Analyses to Multiple Audiences: Regulating Leaded Gasoline
Figure 9.3 Data samples with correlations but different regression lines
Figure C9.2.1 Lead Use in Gasoline Production and Average NHANES II Blood Lead Levels
Table C9.2.1 Basic Regression Model for Estimating the Effects of Gasoline Lead on Blood Lead
Table C9.2.2 Present Values of Costs and Benefits of Final Rule, 1985–1992 (Millions of 1983 Dolla
People also search for Public Policy Analysis: An Integrated Approach 1st:
public policy analysis an integrated approach pdf
public policy analysis an integrated approach routledge
public policy analysis an integrated approach 6th ed
public policy analysis an integrated approach dunn
approaches to public policy analysis
Tags: Public, Policy Analysis, Integrated Approach, William Dunn
You may also like…
Biology and other natural sciences - Ecology
Coastal Wetlands: An Integrated Ecosystem Approach Gerardo Perillo
Education Studies & Teaching - School Education & Teaching
Animals & Pets - Plants & Fungi
Education Studies & Teaching - School Education & Teaching
Business & Economics - Management & Leadership
Strategic Management: Theory: An Integrated Approach Charles W.L. Hill
Science (General)
Quantum Field Theory An Integrated Approach 1st Edition Eduardo Fradkin


