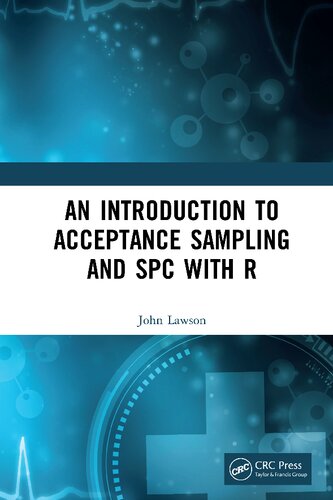
An Introduction to Acceptance Sampling and SPC with R 1st Edition by John Lawson ISBN 0367569957 9780367569952
$50.00 Original price was: $50.00.$25.00Current price is: $25.00.
An Introduction to Acceptance Sampling and SPC with R 1st Edition by John Lawson – Ebook PDF Instant Download/Delivery: 0367569957, 978-0367569952
Full download An Introduction to Acceptance Sampling and SPC with R 1st Edition after payment
Product details:
ISBN 10: 0367569957
ISBN 13: 978-0367569952
Author: John Lawson
An Introduction to Acceptance Sampling and SPC with R is an introduction to statistical methods used in monitoring, controlling and improving quality. Topics covered include acceptance sampling; Shewhart control charts for Phase I studies; graphical and statistical tools for discovering and eliminating the cause of out-of-control-conditions; Cusum and EWMA control charts for Phase II process monitoring; and the design and analysis of experiments for process troubleshooting and discovering ways to improve process output. Origins of statistical quality control and the technical topics presented in the remainder of the book are those recommended in the ANSI/ASQ/ISO guidelines and standards for industry. The final chapter ties everything together by discussing modern management philosophies that encourage the use of the technical methods presented earlier.
In the modern world sampling plans and the statistical calculations used in statistical quality control are done with the help of computers. As an open source high-level programming language with flexible graphical output options, R runs on Windows, Mac and Linux operating systems, and has add-on packages that equal or exceed the capability of commercial software for statistical methods used in quality control. In this book, we will focus on several R packages. In addition to demonstrating how to use R for acceptance sampling and control charts, this book will concentrate on how the use of these specific tools can lead to quality improvements both within a company and within their supplier companies.
This would be a suitable book for a one-semester undergraduate course emphasizing statistical quality control for engineering majors (such as manufacturing engineering or industrial engineering), or a supplemental text for a graduate engineering course that included quality control topics.
An Introduction to Acceptance Sampling and SPC with R 1st Table of contents:
1. Introduction and Historical Background
- 1.1 Origins of Statistical Quality Control
- 1.2 Expansion and Development of Statistical Quality Control during WW II
- 1.3 Use and Further Development of Statistical Quality Control in Post-War Japan
- 1.4 Re-emergence of Statistical Quality Control in U.S. and the World
2. Attribute Sampling Plans
- 2.1 Introduction
- 2.2 Attribute Data
- 2.3 Attribute Sampling Plans
- 2.4 Single Sample Plans
- 2.5 Double and Multiple Sampling Plans
- 2.6 Rectification Sampling
- 2.7 Dodge-Romig Rectification Plans
- 2.8 Sampling Schemes
- 2.9 Quick Switching Scheme
- 2.10 MIL-STD-105E and Derivatives
- 2.11 MIL-STD-1916
- 2.12 Summary
- 2.13 Exercises
3. Variables Sampling Plans
- 3.1 The k-Method
- 3.1.1 Lower Specification Limit
- 3.1.1.1 Standard Deviation Known
- 3.1.1.2 Standard Deviation Unknown
- 3.1.2 Upper Specification Limit
- 3.1.2.1 Standard Deviation Known
- 3.1.2.2 Standard Deviation Unknown
- 3.1.3 Upper and Lower Specification Limits
- 3.1.3.1 Standard Deviation Known
- 3.1.3.2 Standard Deviation Unknown
- 3.1.1 Lower Specification Limit
- 3.2 The M-Method
- 3.2.1 Lower Specification Limit
- 3.2.1.1 Standard Deviation Known
- 3.2.1.2 Standard Deviation Unknown
- 3.2.2 Upper Specification Limit
- 3.2.2.1 Standard Deviation Known
- 3.2.2.2 Standard Deviation Unknown
- 3.2.3 Upper and Lower Specification Limit
- 3.2.3.1 Standard Deviation Known
- 3.2.3.2 Standard Deviation Unknown
- 3.2.1 Lower Specification Limit
- 3.3 Sampling Schemes
- 3.3.1 MIL-STD-414 and Derivatives
- 3.4 Gauge R&R Studies
- 3.5 Additional Reading
- 3.6 Summary
- 3.7 Exercises
4. Shewhart Control Charts in Phase I
- 4.1 Introduction
- 4.2 Variables Control Charts in Phase I
- 4.2.1 Use of X¯ -R charts in Phase I
- 4.2.2 X¯ and R Charts
- 4.2.3 Interpreting Charts for Assignable Cause Signals
- 4.2.4 X¯ and s Charts
- 4.2.5 Variable Control Charts for Individual Values
- 4.3 Attribute Control Charts in Phase I
- 4.3.1 Use of a p Chart in Phase I
- 4.3.2 Constructing other types of Attribute Charts with qcc
- 4.4 Finding Root Causes and Preventive Measures
- 4.4.1 Introduction
- 4.4.2 Flowcharts
- 4.4.3 PDCA or Shewhart Cycle
- 4.4.4 Cause-and-Effect Diagrams
- 4.4.5 Check Sheets or Quality Information System
- 4.4.6 Line Graphs or Run Charts
- 4.4.7 Pareto Diagrams
- 4.4.8 Scatter Plots
- 4.5 Process Capability Analysis
- 4.6 OC and ARL Characteristics of Shewhart Control Charts
- 4.6.1 OC and ARL for Variables Charts
- 4.6.2 OC and ARL for Attribute Charts
- 4.7 Summary
- 4.8 Exercises
5. DoE for Troubleshooting and Improvement
- 5.1 Introduction
- 5.2 Definitions
- 5.3 2k Designs
- 5.3.1 Examples
- 5.3.2 Example 1: A 23 Factorial in Battery Assembly
- 5.3.3 Example 2: Unreplicated 24 Factorial in Injection Molding
- 5.4 2k–p Fractional Factorial Designs
- 5.4.1 One-Half Fraction Designs
- 5.4.2 Example of a One-half Fraction of a 25 Designs
- 5.4.3 One-Quarter and Higher Order Fractions of 2k Designs
- 5.4.4 An Example of a ⅛th Fraction of a 27 Design
- 5.5 Alternative Screening Designs
- 5.5.1 Example
- 5.6 Response Surface and Definitive Screening Experiments
- 5.7 Additional Reading
- 5.8 Summary
- 5.9 Exercises
6. Time Weighted Control Charts in Phase II
- 6.1 Time Weighted Control Charts When the In-control μ and σ are known
- 6.1.1 Cusum Charts
- 6.1.1.1 Headstart Feature
- 6.1.1.2 ARL of Shewhart and Cusum Control Charts for Phase II Monitoring
- 6.1.2 EWMA Charts
- 6.1.2.1 ARL of EWMA, Shewhart and Cusum Control Charts for Phase II Monitoring
- 6.1.2.2 EWMA with FIR Feature
- 6.1.1 Cusum Charts
- 6.2 Time Weighted Control Charts of Individuals to Detect Changes in σ
- 6.3 Examples
- 6.4 Time Weighted Control Charts Using Phase I estimates of μ and σ
- 6.5 Time Weighted Charts for Phase II Monitoring of Attribute Data
- 6.5.1 Cusum for Attribute Data
- 6.5.2 EWMA for Attribute Data
- 6.6 Exercises
7. Multivariate Control Charts
- 7.1 Introduction
- 7.2 T2-Control Charts and Upper Control Limit for T2 Charts
- 7.3 Multivariate Control Charts with Sub-grouped Data
- 7.3.1 Phase I T2 Control Chart with Sub-grouped Data
- 7.3.2 Multivariate Control Charts for Monitoring Variability with Sub-grouped Data
- 7.3.3 Phase II T2 Control Chart with Sub-grouped Data
- 7.4 Multivariate Control Charts with Individual Data
- 7.4.1 Phase I T2 with Individual Data
- 7.4.2 Phase II T2 Control Chart with Individual Data
- 7.4.3 Interpreting Out-of-control Signals
- 7.4.4 Multivariate EWMA Charts with Individual Data
- 7.5 Summary
- 7.6 Exercises
8. Quality Management Systems
- 8.1 Introduction
- 8.2 Quality Systems Standards and Guidelines
- 8.2.1 ISO 9000
- 8.2.2 Industry Specific Standards
- 8.2.3 Malcolm Baldridge National Quality Award Criteria
- 8.3 Six-Sigma Initiatives
- 8.3.1 Brief Introduction to Six Sigma
- 8.3.2 Organizational Structure of a Six Sigma Organization
- 8.3.3 The DMAIC Process and Six Sigma Tools
- 8.3.4 Tools Used in the DMAIC Process
- 8.3.5 DMAIC Process Steps
- 8.3.6 History and Results Achieved by the Six Sigma Initiative
- 8.3.7 Six Sigma Black Belt Certification
- 8.4 Additional Reading
- 8.5 Summary
People also search for An Introduction to Acceptance Sampling and SPC with R 1st:
introduction to acceptance and commitment therapy
intro to acceptance and commitment therapy
how to respond to an e-introduction
general acceptance
how to write an acceptance letter to a job offer
Tags:
John Lawson,Introduction,Acceptance,Sampling,SPC with R 1st
You may also like…
Business & Economics - Management & Leadership
Introduction to Hospitality Management 4th Edition John R Walker
Computers - Computer Science
Computers - Databases
Introduction to machine learning with R rigorous mathematical analysis First Edition Burger
Computers - Programming
Business & Economics - Management & Leadership
Theory of Sampling and Sampling Practice, Third Edition Francis R Pitard
Science (General)
Acceptance Sampling in Quality Control Third Edition Edward G. Schilling
Politics & Philosophy - Social Sciences
Population: An Introduction to Concepts and Issues 13th Edition John R. Weeks


