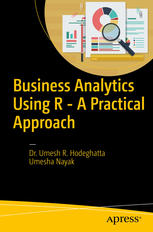
Business Analytics Using R A Practical Approach 1st Edition by Umesh Hodeghatta, Umesha Nayak 1484225141 9781484225141
$50.00 Original price was: $50.00.$25.00Current price is: $25.00.
Business Analytics Using R – A Practical Approach 1st Edition by Umesh R. Hodeghatta, Umesha Nayak – Ebook PDF Instant Download/DeliveryISBN: 1484225141, 9781484225141
Full download Business Analytics Using R – A Practical Approach 1st Edition after payment.
Product details:
ISBN-10 : 1484225141
ISBN-13 : 9781484225141
Author: Umesh R. Hodeghatta, Umesha Nayak
Learn the fundamental aspects of the business statistics, data mining, and machine learning techniques required to understand the huge amount of data generated by your organization. This book explains practical business analytics through examples, covers the steps involved in using it correctly, and shows you the context in which a particular technique does not make sense. Further, Practical Business Analytics using R helps you understand specific issues faced by organizations and how the solutions to these issues can be facilitated by business analytics. This book will discuss and explore the following through examples and case studies: An introduction to R: data management and R functions The architecture, framework, and life cycle of a business analytics project Descriptive analytics using R: descriptive statistics and data cleaning Data mining: classification, association rules, and clustering Predictive analytics: simple regression, multiple regression, and logistic regression This book includes case studies on important business analytic techniques, such as classification, association, clustering, and regression. The R language is the statistical tool used to demonstrate the concepts throughout the book. What You Will Learn • Write R programs to handle data • Build analytical models and draw useful inferences from them • Discover the basic concepts of data mining and machine learning • Carry out predictive modeling • Define a business issue as an analytical problem Who This Book Is For Beginners who want to understand and learn the fundamentals of analytics using R. Students, managers, executives, strategy and planning professionals, software professionals, and BI/DW professionals.
Business Analytics Using R – A Practical Approach 1st table of contents:
Chapter 1: Overview of Business Analytics
1.1 Objectives of This Book
1.2 Confusing Terminology
1.3 Drivers for Business Analytics
1.3.1 Growth of Computer Packages and Applications
1.3.2 Feasibility to Consolidate Data from Various Sources
1.3.3 Growth of Infinite Storage and Computing Capability
1.3.4 Easy-to-Use Programming Tools and Platforms
1.3.5 Survival and Growth in the Highly Competitive World
1.3.6 Business Complexity Growing out of Globalization
1.4 Applications of Business Analytics
1.4.1 Marketing and Sales
1.4.2 Human Resources
1.4.3 Product Design
1.4.4 Service Design
1.4.5 Customer Service and Support Areas
1.5 Skills Required for a Business Analyst
1.5.1 Understanding the Business and Business Problems
1.5.2 Understanding Data Analysis Techniques and Algorithms
1.5.3 Having Good Computer Programming Knowledge
1.5.4 Understanding Data Structures and Data Storage/Warehousing Techniques
1.5.5 Knowing Relevant Statistical and Mathematical Concepts
1.6 Life Cycle of a Business Analytics Project
1.7 The Framework for Business Analytics
1.8 Summary
Chapter 2: Introduction to R
2.1 Data Analysis Tools
2.2 R Installation
2.2.1 Installing R
2.2.2 Installing RStudio
2.2.3 Exploring the RStudio Interface
2.3 Basics of R Programming
2.3.1 Assigning Values
2.3.2 Creating Vectors
2.4 R Object Types
2.5 Data Structures in R
2.5.1 Matrices
2.5.2 Arrays
2.5.3 Data Frames
2.5.4 Lists
2.5.5 Factors
2.6 Summary
Chapter 3: R for Data Analysis
3.1 Reading and Writing Data
3.1.1 Reading Data from a Text File
3.1.2 Reading Data from a Microsoft Excel File
3.1.3 Reading Data from the Web
3.2 Using Control Structures in R
3.2.1 if-else
3.2.2 for loops
3.2.3 while loops
3.2.4 Looping Functions
3.2.4.1 apply( )
3.2.4.2 lapply( )
3.2.4.3 sapply( )
3.2.4.4 tapply( )
3.2.4.5 cut( )
3.2.4.6 split( )
3.2.5 Writing Your Own Functions in R
3.3 Working with R Packages and Libraries
3.4 Summary
Chapter 4: Introduction to descriptive analytics
4.1 Descriptive analytics
4.2 Population and sample
4.3 Statistical parameters of interest
4.3.1 Mean
4.3.2 Median
4.3.3 Mode
4.3.4 Range
4.3.5 Quantiles
4.3.6 Standard deviation
4.3.7 Variance
4.3.8 “Summary” command in R
4.4 Graphical description of the data
4.4.1 Plots in R
4.4.2 Histogram
4.4.3 Bar plot
4.4.4 Boxplots
4.5 Computations on data frames
4.5.1 Scatter plot
4.6 Probability
4.6.1 Probability of mutually exclusive events
4.6.2 Probability of mutually independent events
4.6.3 Probability of mutually non-exclusive events:
4.6.4 Probability distributions
4.6.4.1 Normal distribution
4.6.4.2 Binomial distribution
4.6.4.3 Poisson distribution
4.7 Chapter summary
Chapter 5: Business Analytics Process and Data Exploration
5.1 Business Analytics Life Cycle
5.1.1 Phase 1: Understand the Business Problem
5.1.2 Phase 2: Collect and Integrate the Data
5.1.3 Phase 3: Preprocess the Data
5.1.4 Phase 4: Explore and Visualize the Data
5.1.5 Phase 5: Choose Modeling Techniques and Algorithms
5.1.6 Phase 6: Evaluate the Model
5.1.7 Phase 7: Report to Management and Review
5.1.8 Phase 8: Deploy the Model
5.2 Understanding the Business Problem
5.3 Collecting and Integrating the Data
5.3.1 Sampling
5.3.2 Variable Selection
5.4 Preprocessing the Data
5.4.1 Data Types
5.4.2 Data Preparation
5.4.2.1 Handling Missing Values
5.4.2.2 Handling Duplicates, Junk, and Null Values
5.4.3 Data Preprocessing with R
5.5 Exploring and Visualizing the Data
5.5.1 Tables
5.5.2 Summary Tables
5.5.3 Graphs
5.5.3.1 Box plots
5.5.3.2 Scatter plots
5.5.4 Scatter Plot Matrices
5.5.4.1 Trellis Plot
5.5.4.2 Correlation plot
5.5.4.3 Density by Class
5.5.5 Data Transformation
5.5.5.1 Normalization
5.6 Using Modeling Techniques and Algorithms
5.6.1 Descriptive Analytics
5.6.2 Predictive Analytics
5.6.3 Machine Learning
5.6.3.1 Supervised Machine Learning
5.6.3.2 Unsupervised Machine Learning
5.7 Evaluating the Model
5.7.1 Training Data Partition
5.7.2 Test Data Partition
5.7.3 Validation Data Partition
5.7.4 Cross-Validation
5.7.5 Classification Model Evaluation
5.7.5.1 Confusion Matrix
5.7.5.2 Lift Chart
5.7.5.3 ROC Chart
5.7.6 Regression Model Evaluation
5.7.6.1 Root-Mean-Square Error
5.8 Presenting a Management Report and Review
5.8.1 Problem Description
5.8.2 Data Set Used
5.8.3 Data Cleaning Carried Out
5.8.4 Method Used to Create the Model
5.8.5 Model Deployment Prerequisites
5.8.6 Model Deployment and Usage
5.8.7 Issues Handling
5.9 Deploying the Model
5.10 Summary
Chapter 6: Supervised Machine Learning—Classification
6.1 What Is Classification? What Is Prediction?
6.2 Probabilistic Models for Classification
6.2.1 Example
6.2.2 Naïve Bayes Classifier Using R
6.2.3 Advantages and Limitations of the Naïve Bayes Classifier
6.3 Decision Trees
6.3.1 Recursive Partitioning Decision-Tree Algorithm
6.3.2 Information Gain
6.3.3 Example of a Decision Tree
6.3.4 Induction of a Decision Tree
6.3.5 Classification Rules from Tree
6.3.6 Overfitting and Underfitting
6.3.7 Bias and Variance
6.3.8 Avoiding Overfitting Errors and Setting the Size of Tree Growth
6.3.8.1 Limiting Tree Growth
6.3.8.2 Pruning the Tree
6.4 Other Classifier Types
6.4.1 K-Nearest Neighbor
6.4.2 Random Forests
6.5 Classification Example Using R
6.6 Summary
Chapter 7: Unsupervised Machine Learning
7.1 Clustering – Overview
7.2 What Is Clustering?
7.2.1 Measures Between Two Records
7.2.1.1 Euclidean Distance and Manhattan Distance
7.2.1.2 Pearson Product Correlation (Statistical Measurement)
7.2.2 Distance Measures for Categorical Variables
7.2.3 Distance Measures for Mixed Data Types
7.2.4 Distance Between Two Clusters
7.2.4.1 Single Linkage (Minimum Distance)
7.2.4.2 Complete Linkage (Maximum Distance)
7.2.4.3 Average Linkage (Average Distance)
7.2.4.4 Centroid Distance
7.3 Hierarchical Clustering
7.3.1 Dendrograms
7.3.2 Limitations of Hierarchical Clustering
7.4 Nonhierarchical Clustering
7.4.1 K-Means Algorithm
7.4.2 Limitations of K-Means Clustering
7.5 Clustering Case Study
7.5.1 Retain Only Relevant Variables in the Data Set
7.5.2 Remove Any Outliers from the Data Set
7.5.3 Standardize the Data
7.5.4 Calculate the Distance Between the Data Points
7.5.4.1 Use the Selected Approaches to Carry Out the Clustering
7.5.4.2 Hierarchical Clustering Approach
7.5.4.3 Partition Clustering Approach
7.6 Association Rule
7.6.1 Choosing Rules
7.6.1.1 Support and Confidence
7.6.1.2 Lift
7.6.2 Example of Generating Association Rules
7.6.3 Interpreting Results
7.7 Summary
Chapter 8: Simple Linear Regression
8.1 Introduction
8.2 Correlation
8.2.1 Correlation Coefficient
8.3 Hypothesis Testing
8.4 Simple Linear Regression
8.4.1 Assumptions of Regression
8.4.2 Simple Linear Regression Equation
8.4.3 Creating Simple Regression Equation in R
8.4.4 Testing the Assumptions of Regression:
8.4.4.1 Test of Linearity
8.4.4.2 Test of Independence of Errors Around the Regression Line
8.4.4.3 Test of Normality
8.4.4.4 Equal variance of the distribution of the response variable
8.4.4.5 Other ways of validating the assumptions to be fulfilled by a Regression model
8.4.4.5.1 Using gvlma library
8.4.4.5.2 Using the Scale-Location Plot
8.4.4.5.3 Using crPlots(model name) function from library(car)
8.4.5 Conclusion
8.4.6 Predicting the Response Variable
8.4.7 Additional Notes
8.5 Chapter Summary
Chapter 9: Multiple Linear Regression
9.1 Using Multiple Linear Regression
9.1.1 The Data
9.1.2 Correlation
9.1.3 Arriving at the Model
9.1.4 Validation of the Assumptions of Regression
9.1.5 Multicollinearity
9.1.6 Stepwise Multiple Linear Regression
9.1.7 All Subsets Approach to Multiple Linear Regression
9.1.8 Multiple Linear Regression Equation
9.1.9 Conclusion
9.2 Using an Alternative Method in R
9.3 Predicting the Response Variable
9.4 Training and Testing the Model
9.5 Cross Validation
9.6 Summary
Chapter 10: Logistic Regression
10.1 Logistic Regression
10.1.1 The Data
10.1.2 Creating the Model
10.1.3 Model Fit Verification
10.1.4 General Words of Caution
10.1.5 Multicollinearity
10.1.6 Dispersion
10.1.7 Conclusion for Logistic Regression
10.2 Training and Testing the Model
10.2.1 Predicting the Response Variable
10.2.2 Alternative Way of Validating the Logistic Regression Model
10.3 Multinomial Logistic Regression
10.4 Regularization
10.5 Summary
Chapter 11: Big Data Analysis—Introduction and Future Trends
11.1 Big Data Ecosystem
11.2 Future Trends in Big Data Analytics
11.2.1 Growth of Social Media
11.2.2 Creation of Data Lakes
11.2.3 Visualization Tools at the Hands of Business Users
11.2.4 Prescriptive Analytics
11.2.5 Internet of Things
11.2.6 Artificial Intelligence
11.2.7 Whole Data Processing
11.2.8 Vertical and Horizontal Applications
11.2.9 Real-Time Analytics
11.2.10 Putting the Analytics in the Hands of Business Users
11.2.11 Migration of Solutions from One Tool to Another
11.2.12 Cloud, Cloud, Everywhere the Cloud
11.2.13 In-Database Analytics
11.2.14 In-Memory Analytics
11.2.15 Autonomous Services for Machine Learning
11.2.16 Addressing Security and Compliance
11.2.17 Healthcare
People also search for Business Analytics Using R – A Practical Approach 1st:
basic business analytics using r
introduction to business analytics using simulation
introduction to business analytics using simulation pdf
practical business analytics using sas
introduction to business analytics using r
Tags: Business Analytics, Practical Approach, Umesh Hodeghatta, Umesha Nayak
You may also like…
Business & Economics - Econometrics
Business Analytics 2nd Edition by James Evans ISBN 129209544X 9781292095448
Business & Economics - Others
Science (General) - Research & Development
Business & Economics
Computers - Computer Science
Science (General) - Research & Development
Qualitative Research Using R A Systematic Approach Yanto Chandra


