
Experimental Methods For Science And Engineering Students An Introduction To The Analysis And Presentation Of Data 2nd edition by Les Kirkup ISBN 1108307957 9781108307956

Original price was: $50.00.$25.00Current price is: $25.00.
Experimental Methods For Science And Engineering Students An Introduction To The Analysis And Presentation Of Data 2nd edition by Les Kirkup- Ebook PDF Instant Download/Delivery: 1108307957, 978- 1108307956
Full download Experimental Methods For Science And Engineering Students An Introduction To The Analysis And Presentation Of Data 2nd Edition after payment
Product details:
ISBN 10: 1108307957
ISBN 13: 978-1108307956
Author: Les Kirkup
Responding to the developments of the past twenty years, Les Kirkup has thoroughly updated his popular book on experimental methods, while retaining the extensive coverage and practical advice from the first edition. Many topics from that edition remain, including keeping a record of work, how to deal with measurement uncertainties, understanding the statistical basis of data analysis and reporting the results of experiments. However, with new technologies influencing how experiments are devised, carried out, analyzed, presented and reported, this new edition reflects the digital changes which have taken place and the increased emphasis on the importance of communication skills in reporting results. Bringing together key elements of experimental methods into one coherent book, it is perfect for students seeking guidance with their experimental work, including how to acquire, analyse and present data. Exercises, worked examples and end-of-chapter problems are provided throughout the book to reinforce fundamental principles.
Experimental Methods For Science And Engineering Students An Introduction To The Analysis And Presentation Of Data 2nd Table of contents:
1. Introduction to Experimentation
- Overview: The importance of experiments in scientific discovery and engineering applications.
- Stages of an Experiment: Steps from aim to reporting, including planning, data collection, repeatability, and analysis.
- Documenting Your Work: Guidance on keeping a lab notebook and documenting experiments, including open-ended and project-based work.
2. Characteristics of Experimental Data
- Overview: Key features of experimental data.
- Units of Measurement: Introduction to SI units and their multiples and subdivisions.
- Tabulation of Data: Organizing data, including scientific notation.
- Uncertainties in Measurement: Discussion on sources of uncertainties, including significant figures, estimation, and rounding.
- Significant Figures: Proper usage and rules for significant figures in calculations.
- Estimation and Fermi Problems: Techniques for rough estimation and solving complex problems with approximate methods.
3. Graphical Presentation of Data
- Overview: The importance of using graphs for data presentation.
- Plotting Graphs: Understanding variables, scales, symbols, error bars, and when to plot graphs.
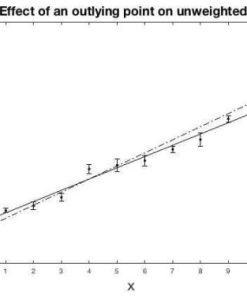
- Linear x–y Graphs: How to fit a line, handle outliers, and calculate slope and intercept.
- Logarithmic Graphs: Using log-log graphs for specific data types.
4. Dealing with Uncertainties
- Overview: Understanding and managing measurement uncertainties.
- Types of Uncertainty: Resolution, reading, calibration uncertainties, and systematic vs. random errors.
- Best Estimate and Repeat Measurements: Techniques for averaging data and quoting uncertainties.
- Systematic and Random Errors: Identifying and correcting errors, including offset and gain errors.
- Combining Uncertainties: Methods for adding, subtracting, multiplying, and dividing uncertainties.
5. Statistical Approach to Variability in Measurements
- Overview: Using statistics to estimate uncertainties.
- Variance and Standard Deviation: Calculating variability and confidence intervals.
- Histograms and Normal Distribution: Displaying data and understanding the properties of normal distributions.
- Combining Uncertainties in Statistics: How to combine uncertainties when errors are uncorrelated.
6. Fitting a Line to x–y Data Using the Method of Least Squares
- Overview: Fitting data to a line using least squares fitting.
- Standard Errors: Calculating uncertainties in slope and intercept.
- Weighted Fits: Handling weighted data and adjusting fits accordingly.
- Correlation Coefficient: Understanding the linear correlation coefficient and its significance.
7. Report Writing and Presentations
- Overview: Best practices for reporting and presenting experimental findings.
- Scientific or Technical Report: Structure, sections, and preparation for writing reports.
- Posters: Guidelines for preparing and presenting scientific posters.
- Oral Presentations: Preparing and delivering effective oral presentations with visual aids.
8. Using Excel to Present and Analyse Data
- Overview: Using Excel for data analysis and visualization.
- Spreadsheet Basics: Basic functions for calculating and organizing data.
- Statistical Functions in Excel: Built-in functions and examples for data analysis.
- Data Visualization: Creating histograms, x-y graphs, and other visual aids.
- Advanced Excel Features: Exploring additional tools like the Analysis ToolPak and nonlinear least squares fitting.
9. Computer-Aided Data Capture
- Overview: Using computers to assist in data collection and analysis.
- Transducers and Signal Conditioning: Introduction to hardware tools that collect data.
- Analogue to Digital Conversion: Understanding how analogue signals are converted to digital data.
- Data Acquisition Systems: Overview of various systems, including Arduino and smartphone-based data collection.
People also search for Experimental Methods For Science And Engineering Students An Introduction To The Analysis And Presentation Of Data 2nd:
experimental methods for computer science research
easy experiment to demonstrate scientific method
what are experimental methods
scientific methods experiments
research methods for experiments
Tags:
Les Kirkup,Experimental,Methods,Science,Engineering,Students,Introduction,Analysis,Presentation,Data 2nd
You may also like…
Engineering
Measurement and Data Analysis for Engineering and Science, Fourth Edition Patrick F Dunn
Politics & Philosophy - Social Sciences
Forensic Science
Education Studies & Teaching

Biology and other natural sciences - Plants: Agriculture and Forestry