
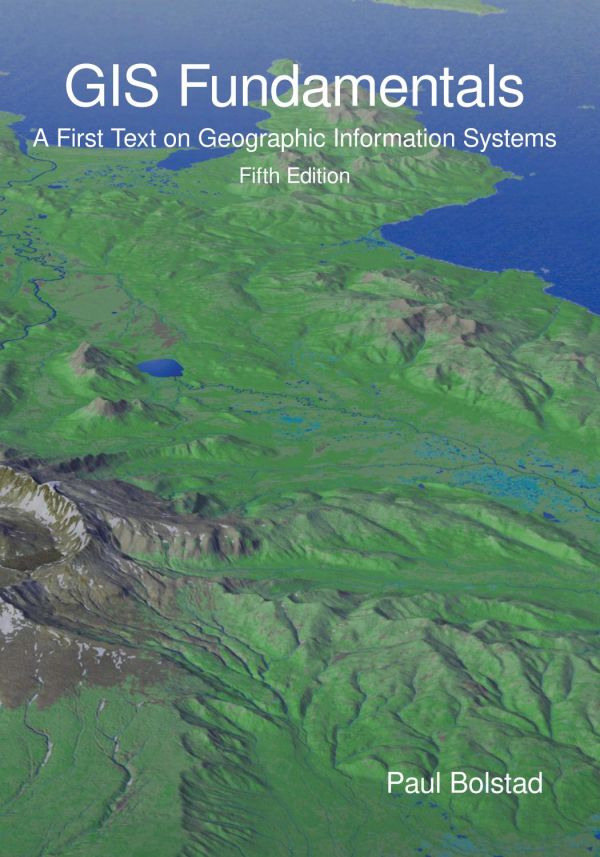
GIS Fundamentals A First Text on Geographic Information Systems 5th edition by Paul Bolstad 1506695876 9781506695877


Original price was: $50.00.$25.00Current price is: $25.00.
GIS Fundamentals A First Text on Geographic Information Systems 5th edition by Paul Bolstad- Ebook PDF Instant Download/Delivery:1506695876 ,9781506695877
Full download GIS Fundamentals A First Text on Geographic Information Systems 5th edition after payment
Product details:
ISBN 10:1506695876
ISBN 13: 9781506695877
Author: Paul Bolstad
Geographic Information Systems (GIS) are computer-based tools for the entry, maintenance, and analysis of spatial data. GIS are critical for effective resource management, and have been applied across a wide range of science, business, and government endeavours.This book provides an introduction to the theory and application of GIS. It is written for use in an introductory GIS class and as a reference for the GIS practitioner. This fifth edition balances theoretical and applied material, so that students may apply knowledge of GIS in the solution of real-world problems. Improvements over the previous editions are included in each chapter. Topics treated include an introduction to GIS, spatial data models, map projections, data entry, image data, GPS, digital data, database systems in GIS, general spatial analysis, raster analysis, terrain modeling, metadate, standards, and accuracy assessments.
GIS Fundamentals A First Text on Geographic Information Systems 5th Table of contents:
Figure 1-1 : A map of northern South America and southern Central America made by Diego Gutiérrez i
What is a GIS?
Figure 1-2 : GIS allow us to analyze important geographic features. The satellite image at the cente
Why We Need GIS
Figure 1-3 : The environmental impacts wrought by humans have accelerated in many parts of the world
Figure 1-4 : GIS may aid in disaster assessment and recovery. This satellite image shows the Camp fi
Figure 1-5 : Portable computing is one example of the technological pull driving GIS adoption (court
Figure 1-6 : Images taken from aircraft and satellites (left) provide a rich source of data, which m
GIS in Action
Figure 1-7 : Search and rescue operations, such as the one for Marvin Matsumoto (upper left, inset),
Figure 1-8 : Parcel information entered in a GIS may substantially improve government services. Here
Figure 1-9 : GIS may be used to streamline government function. Here, septic systems not compliant w
Figure 1-10 : A gray wolf, one of a few successfully recovered endangered species, restored with the
Figure 1-11 : Wolf recovery involves tranquilizing and fitting wolves with tracking collars. These p
Figure 1-12 : Spatial data, such as the recorded pack locations and home ranges (circles and polygon
Figure 1-13 : Air pollution from power plants and vehicles is still a significant health hazard (cou
Figure 1-14 : Small air pollution particles (dark spots, above) lodge in lungs and cause life-long d
Figure 1-15 : Scientists at NASA have developed methods to map air pollution across continents on a
Figure 1-16 : Towable samplers help measure air pollution for individual streets, at various traffic
Figure 1-17 : Fine-detailed spatial estimates of particulate air pollutants (courtesy J. Marshall).
GIS Components
Hardware for GIS
Figure 1-18 : GIS are used in a range of computing environments and network configurations, from sta
GIS Software
Figure 1-19 : Functions commonly provided by GIS software.
Open Geospatial Consortium
ArcGIS
QGIS
GeoMedia
Idrisi
AUTOCAD MAP 3D
GRASS
Bentley Map
Spatial R, Python, and GDAL
GIS in Organizations
Figure 1-20 : GIS exist in an institutional context. Effective use of GIS depends on a set of protoc
Summary
The Structure of This Book
Suggested Reading
Study Questions
Data Models
Geodesy, Datums, Map Projections, and Coordinate Systems
Maps, Data Entry, Editing, and Output
Global Navigation Satellite Systems and Coordinate Surveying
Introduction
Figure 5-1 : A GNSS and data collection package fit for long-term songbird tracking (courtesy Alex J
GNSS Basics
Figure 5-2 : The three segments that comprise a GNSS.
Figure 5-3 : A handheld GNSS receiver (left) and a GNSS receiver in use (right, courtesy Juniper Sys
GNSS Signals
Table 5-1 : GPS Signals
Figure 5-4 : Existing and proposed GNSS broadcast signals, frequencies, and positioning services. Si
Range Distances
Figure 5-5 : A single satellite range measurement.
Range = speed of light * travel time (5.1)
Figure 5-6 : A decoded C/A satellite signal provides a range measurement.
Figure 5-7 : Range measurements from multiple GNSS satellites. Range measurements are combined to na
Positional Uncertainty
Figure 5-8 : Uncertainty in range measurements leads to positional errors in GNSS measurements.
Sources of Range Error
Figure 5-9 : GNSS receivers often discard signals from satellites near the horizon. As this image sh
Satellite Geometry and Dilution of Precision
Figure 5-10 : Relative GPS satellite position affects positional accuracy. Range uncertainties are a
Figure 5-11 : GPS satellite distribution affects positional accuracy. Closely spaced satellites resu
Figure 5-12 : Observed GPS error distributions for various receivers under open sky conditions (a th
Differential Correction
Figure 5-13 : Differential GNSS positioning.
Figure 5-14 : Differential correction is based on measuring GNSS timing and range errors at a base s
Figure 5-15 : Post-processed and real-time differential GNSS correction.
Real-time Differential Positioning
Figure 5-16 : The location of radio beacon stations (dots) in the central U.S., in April, 2015. Dist
Real-Time Kinematic and Virtual Reference Stations
Figure 5-17 : The distribution of stations in the Minnesota Department of Transportation VRS network
WAAS, Augmentation, and Satellite-based Corrections
Precise Point Positioning
A Caution on Datums
GNSS Applications
Figure 5-18 : A GPS receiver developed for marine (left) and aerial navigation (right, courtesy Garm
Field Digitiziting
Figure 5-19 : Line features may be field digitized via GPS, as in this example of a GIS/GPS system m
Figure 5-20 : Ruggedized tablet computers may be carried in the field and used for data entry. Large
Figure 5-21 : Features may be entered and edited in the field using a GPS receiver and appropriate s
Single-Fix vs Averaged Accuracy
Figure 5-22 : An example of several field-digitized lines, using a professional-grade GNSS receiver
Field Digitizing Accuracy and Efficiency
Figure 5-23 : GPS satellite signals may be blocked by terrain or built structures. This reduces the
Figure 5-24 : A range pole in use with a GNSS receiver.
Figure 5-25 : The percentage of GPS position fixes that are successfully collected decreases in vall
Rangefinder Integration
Figure 5-26 : A laser rangefinder may substantially improve the efficiency of field data collection
GNSS Height Measurement
(5.2)
Figure 5-27 : Calculation of orthometric height from ellipsoidal height. Most GNSS systems report el
GNSS Tracking
Figure 5-28 : A wildebeest fit with a GNSS tracking collar. The antenna is visible as the white patc
Figure 5-29 : GNSS tracking data for wildebeest in the Serengeti and Ngorongoro Crater regions of Ta
Figure 5-30 : Real-time tracking via GPS substantially improves vehicle fleet management, particular
Optical and Laser Coordinate Surveying
Figure 5-31 : Surveying establishes the coordinates for most property lines. Field measurements of d
Figure 5-32 : A surveying instrument for collecting coordinate geometry data.
Figure 5-33 : Angles in surveys may be reported as azimuth angles, measured clockwise relative to No
Figure 5-34 : Directions may be specified as bearings, with a North or South reference, and an East
Figure 5-35 : Conversion formulas from bearing to azimuth, by quadrant.
Figure 5-36 : Coordinate geometry (COGO) allows the calculation of coordinate locations from open (s
Figure 5-37 : Example calculations of dx and dy values, given a survey distance (L) and an azimuth a
Figure 5-38 :Three-dimensional scanning lasers use coordinate geometry to record comprehensive x, y,
Summary
Suggested Reading
Study Questions
Aerial and Satellite Images
Digital Data
Attribute Data and Tables
Basic Spatial Analyses
Topics in Raster Analysis
Terrain Analysis
Spatial Estimation: Interpolation, Prediction, and Core Area Delineation
Introduction
Figure 12-1 : Air quality varies across space and time, and is only measured in a few locations. Spa
Sampling
Sampling Patterns
Figure 12-2 : Examples of a) systematic, b) random, c) cluster, and d) adaptive sampling patterns. S
Spatial Interpolation Methods
Figure 12-3 : Measurement points and values for indicator ozone concentration for 2014. Higher conce
Nearest Neighbor Interpolation
Figure 12-4 : A three-dimensional perspective representation of Thiessen (nearest neighbor) polygons
Figure 12-5 : Sample points and estimated ozone concentrations by Thiessen polygons.
Fixed Radius – Local Averaging
Figure 12-6 : A diagram and example of a fixed radius interpolation. Values within each sampling cir
Figure 12-7 : A perspective diagram of fixed radius sampling. A circle is centered on each raster ce
Figure 12-8 : Original data and sample points, and a fixed radius interpolation. Note that this meth
Inverse Distance Weighted Interpolation
(12.1)
Figure 12-9 : An example calculation for a linear inverse distance weighted interpolator. The values
(12.2)
Figure 12-10 : Inverse distance weighted interpolation typically results in a smooth, gap-free surfa
Splines
Figure 12-11 : Diagram of a two-dimensional (line) spline. Segments are fit to portions of a line. S
Figure 12-12 : A spline-fit surface.
Spatial Prediction
Figure 12-13 : Part a shows spatially autocorrelated (Layer 1) and spatially uncorrelated (Layer 2)
(12.3)
Figure 12-14 : Moran’s I is a measure of the correlation among nearby observations. This example s
(12.4)
Spatial Regression
(12.5)
Trend Surface and Simple Spatial Regression
Z = a0 + a1x + a2y + a3x2 + a4y2 + a5 xy (12.6)
Figure 12-15 : A third-order trend surface fit to the sample points.
Z = ao + a1x + a2y + a3Q + a4W (12.7)
Kriging and Co-Kriging
Figure 12-16 : Lag distances, used in calculating semivariances for kriging.
Figure 12-17 : A lag tolerance defines a range for grouping samples. The grouping aids estimation of
g(h) = 1/2n * S (Za – Zb)2 (12.8)
Figure 12-18 : An idealized variogram, with the nugget, sill, and range identified.
Figure 12-19 : A variogram, a plot of calculated and fit semivariance vs. lag distance.
(12.9)
Figure 12-20 : Sample points and predicted values from an application of kriging to the ozone data.
Prediction Accuracy
(12.10)
(12.11)
(12.12)
(12.13)
(12.14)
(12.15)
(12.16)
Core Area Mapping
Mean Center and Mean Circle
Figure 12-21 : An example of a mean center and corresponding mean circles for a set of sample points
Convex Hulls
Figure 12-22 : A set of points (a) may be enclosed by connecting the “outermost” points in the s
Figure 12-23 : The convex hull for a set of points (a) may be calculated from a sweep algorithm. Sta
Characteristic Hull Polygons
Figure 12-24 : An example of a core area defined by a convex hull (a), and characteristic hull polyg
Kernel Mapping
Figure 12-25 : Kernel mapping is based on the concept of a distribution of observations in space. Ea
(12.17)
Figure 12-26 : A density distribution is assumed, and plotted for each observation. Here an observat
Figure 12-27 : Individual density distributions may be plotted for each sample observation, as shown
(12.18)
Figure 12-28 : We choose both the general form of the density distribution, and a bandwidth paramete
(12.19)
Figure 12-29 : Kernels may be used to map density distributions across a two-dimensional surface. De
(12.20)
Figure 12-30 : Kernel mapping may be used to identify core areas, although the areas that will be de
Time-Geographic Density Estimation
Figure 12-31 : A sequence of observations on a moving object, from an initial time (t0) to a final t
(12.21)
(12.22)
Figure 12-32 : An object is estimated to have been contained within an ellipse, given two subsequent
Figure 12-33 : The process of calculating a geoellipse density between two sequential points, repres
Figure 12-34 : An example of the overlapping set of geoellipses used to create a composite density f
(12.23)
Figure 12-35 : An example time-geographic density function for a sequential set of control points. T
Summary
Suggested Reading
Study Questions
Spatial Models and Modeling
Data Standards and Data Quality
New Developments in GIS
Appendix A: Glossary
Appendix B: Useful Conversions and Information
Appendix C: Answers to Selected Study Questions
People also search for GIS Fundamentals A First Text on Geographic Information Systems 5th:
gis fundamentals a first text on geographic information systems bolstad
gis fundamentals a first text on geographic information systems pdf
b.a first year geography syllabus
what is g.i.s in geography
what are the basic principles of gis
Tags:
Paul Bolstad,Fundamentals,Geographic,Information
You may also like…

Earth Sciences - Geography

Computers - Networking
Fundamentals of information systems security 3rd Edition Kim
Computers - Information Systems

Earth Sciences - Geography
Introduction to geographic information systems Eighth Edition. Edition Chang

Earth Sciences - Geography

Computers - Computer Business & Culture