
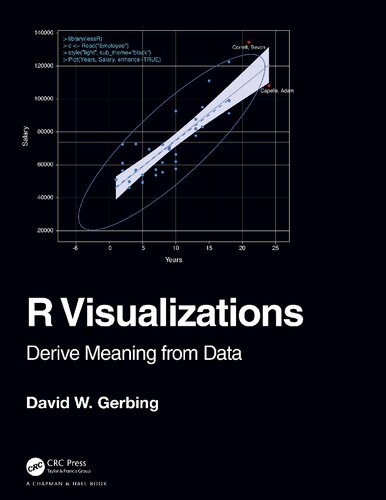
R Visualizations Derive Meaning from Data 1st Edition by David Gerbing ISBN 1138599638 978-1138599635


Original price was: $50.00.$25.00Current price is: $25.00.
R Visualizations Derive Meaning from Data 1st Edition by David Gerbing – Ebook PDF Instant Download/Delivery: 1138599638, 978-1138599635
Full download R Visualizations Derive Meaning from Data 1st Edition after payment
Product details:
ISBN 10: 1138599638
ISBN 13: 978-1138599635
Author: David Gerbing
R Visualizations: Derive Meaning from Data focuses on one of the two major topics of data analytics: data visualization, a.k.a., computer graphics. In the book, major R systems for visualization are discussed, organized by topic and not by system. Anyone doing data analysis will be shown how to use R to generate any of the basic visualizations with the R visualization systems. Further, this book introduces the author’s lessR system, which always can accomplish a visualization with less coding than the use of other systems, sometimes dramatically so, and also provides accompanying statistical analyses.
Key Features
- Presents thorough coverage of the leading R visualization system, ggplot2.
- Gives specific guidance on using base R graphics to attain visualizations of the same quality as those provided by ggplot2.
-
Shows how to create a wide range of data visualizations: distributions of categorical and continuous variables, many types of scatterplots including with a third variable, time series, and maps.
- Inclusion of the various approaches to R graphics organized by topic instead of by system.
- Presents the recent work on interactive visualization in R.
David W. Gerbing received his PhD from Michigan State University in 1979 in quantitative analysis, and currently is a professor of quantitative analysis in the School of Business at Portland State University. He has published extensively in the social and behavioral sciences with a focus on quantitative methods. His lessR package has been in development since 2009.
Table of contents:
- R, Data and Visualizations
- R Visualization Quick Start
- Customization
- Visualize the Distribution of a Categorical Variable
- Visualize the Distribution of a Continuous Variable
- Visualize the Distributions of Values over Time
- Visualize Spatial Data with Maps
- Visualize Three Dimensions
- Visualize Dimensionality Reduction
- Interactive Visualizations
People also search for:
r visualizations derive meaning
r visualizations derive meaning from data
what are visualizations
what does direct visualization mean
what is visualization mean
Tags: David Gerbing, R Visualizations, Derive Meaning, from Data
You may also like…
Politics & Philosophy
Politics & Philosophy - Social Sciences
Better Data Visualizations: A Guide For Scholars, Researchers, And Wonks Jonathan Schwabish
Computers - Programming
Computers - Web Development


Computers - Computers - General & Miscellaneous

Mathematics
Uncertainty analysis of experimental data with R 1st Edition Benjamin David 1315342596 9781315342597