Understanding Software Dynamics 1st Edition by Richard Sites ISBN 0137589786 9780137589784
$50.00 Original price was: $50.00.$25.00Current price is: $25.00.
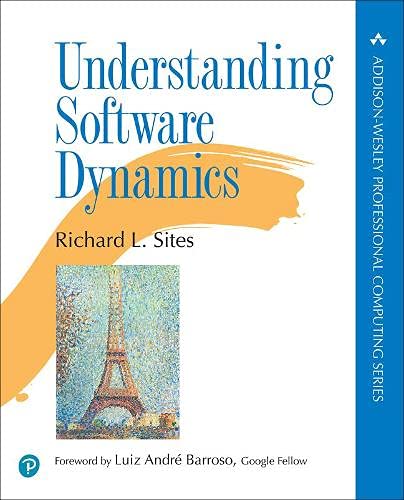
Understanding Software Dynamics 1st Edition by Richard L. Sites – Ebook PDF Instant Download/Delivery: 0137589786, 978-0137589784
Full download Understanding Software Dynamics 1st Edition after payment
Product details:
ISBN 10: 0137589786
ISBN 13: 978- 0137589784
Author: Richard L. Sites
An Expert Guide to Software Performance Optimization
From mobile and cloud apps to video games to driverless vehicle control, more and more software is time-constrained: It must deliver reliable results seamlessly, consistently, and virtually instantaneously. If it doesn’t, customers are unhappy–and sometimes lives are put at risk. When complex software underperforms or fails, software engineers need to identify and address the root causes. This is difficult and, historically, few tools have been available to help.
In Understanding Software Dynamics, performance expert Richard L. Sites tackles the problem head on, offering expert methods and advanced tools for understanding complex, time-constrained software dynamics, improving reliability and troubleshooting challenging performance problems.
Sites draws on several decades of experience pioneering software performance optimization, as well as extensive experience teaching graduate-level developers. He introduces principles and techniques for use in any environment, from embedded devices to datacenters, illuminating them with examples based on x86 or ARM processors running Linux and linked by Ethernet. He also guides readers through building and applying a powerful, new, extremely low-overhead open-source software tool, KUtrace, to precisely trace executions on every CPU core. Using insights gleaned from this tool, readers can apply nuanced solutions–not merely brute-force techniques such as turning off caches or cores.
- Measure and address issues associated with CPUs, memory, disk/SSD, networks, and their interactions
- Fix programs that are always too slow, and those that sometimes lag for no apparent reason
- Design useful observability, logging, and time-stamping capabilities into your code
- Reason more effectively about performance data to see why reality differs from expectations
- Identify problems such as excess execution, slow instruction execution, waiting for resources, and software locks
Understanding Software Dynamics will be valuable to experienced software professionals, including application and OS developers, hardware and system architects, real-time system designers, and game developers, as well as advanced students.
Register your book for convenient access to downloads, updates, and/or corrections as they become available. See inside book for details.
Understanding Software Dynamics 1st Table of contents:
Part I: Measurement
Chapter 1: My Program Is Too Slow
- 1.1 Datacenter Context
- 1.2 Datacenter Hardware
- 1.3 Datacenter Software
- 1.4 Long-Tail Latency
- 1.5 Thought Framework
- 1.6 Order-of-Magnitude Estimates
- 1.7 Why Are Transactions Slow?
- 1.8 The Five Fundamental Resources
- 1.9 Summary
Chapter 2: Measuring CPUs
- 2.1 How We Got Here
- 2.2 Where Are We Now?
- 2.3 Measuring the Latency of an add Instruction
- 2.4 Straight-Line Code Fail
- 2.5 Simple Loop, Loop Overhead Fail, Optimizing Compiler Fail
- 2.6 Dead Variable Fail
- 2.7 Better Loop
- 2.8 Dependent Variables
- 2.9 Actual Execution Latency
- 2.10 More Nuance
- 2.11 Summary
- Exercises
Chapter 3: Measuring Memory
- 3.1 Memory Timing
- 3.2 About Memory
- 3.3 Cache Organization
- 3.4 Data Alignment
- 3.5 Translation Lookaside Buffer Organization
- 3.6 The Measurements
- 3.7 Measuring Cache Line Size
- 3.8 Problem: N+1 Prefetching
- 3.9 Dependent Loads
- 3.10 Non-random Dynamic Random-Access Memory
- 3.11 Measuring Total Size of Each Cache Level
- 3.12 Measuring Cache Associativity of Each Level
- 3.13 Translation Buffer Time
- 3.14 Cache Underutilization
- 3.15 Summary
- Exercises
Chapter 4: CPU and Memory Interaction
- 4.1 Cache Interaction
- 4.2 Simple Matrix Multiply Dynamics
- 4.3 Estimates
- 4.4 Initialization, Cross-Checking, and Observing
- 4.5 Initial Results
- 4.6 Faster Matrix Multiply, Transpose Method
- 4.7 Faster Matrix Multiply, Subblock Method
- 4.8 Cache-Aware Computation
- 4.9 Summary
- Exercises
Chapter 5: Measuring Disk/SSD
- 5.1 About Hard Disks
- 5.2 About SSDs
- 5.3 Software Disk Access and On-Disk Buffering
- 5.4 How Fast Is a Disk Read?
- 5.5 A Little Back-of-the-Envelope Calculation
- 5.6 How Fast Is a Disk Write?
- 5.7 Results
- 5.8 Reading from Disk
- 5.9 Writing to Disk
- 5.10 Reading from SSD
- 5.11 Writing to SSD
- 5.12 Multiple Transfers
- 5.13 Summary
- Exercises
Chapter 6: Measuring Networks
- 6.1 About Ethernet
- 6.2 About Hubs, Switches, and Routers
- 6.3 About TCP/IP
- 6.4 About Packets
- 6.5 About Remote Procedure Calls (RPCs)
- 6.6 Slop
- 6.7 Observing Network Traffic
- 6.8 Sample RPC Message Definition
- 6.9 Sample Logging Design
- 6.10 Sample Client-Server System Using RPCs
- 6.11 Sample Server Program
- 6.12 Spinlocks
- 6.13 Sample Client Program
- 6.14 Measuring One Sample Client-Server RPC
- 6.15 Postprocessing RPC Logs
- 6.16 Observations
- 6.17 Summary
- Exercises
Chapter 7: Disk and Network Database Interaction
- 7.1 Time Alignment
- 7.2 Multiple Clients
- 7.3 Spinlocks
- 7.4 Experiment 1
- 7.5 On-Disk Database
- 7.6 Experiment 2
- 7.7 Experiment 3
- 7.8 Logging
- 7.9 Understanding Transaction Latency Variation
- 7.10 Summary
- Exercises
Part II: Observation
Chapter 8: Logging
- 8.1 Observation Tools
- 8.2 Logging
- 8.3 Basic Logging
- 8.4 Extended Logging
- 8.5 Timestamps
- 8.6 RPC IDs
- 8.7 Log File Formats
- 8.8 Managing Log Files
- 8.9 Summary
Chapter 9: Aggregate Measures
- 9.1 Uniform vs. Bursty Event Rates
- 9.2 Measurement Intervals
- 9.3 Timelines
- 9.4 Further Summarizing of Timelines
- 9.5 Histogram Time Scales
- 9.6 Aggregating Per-Event Measurements
- 9.7 Patterns of Values Over Time
- 9.8 Update Intervals
- 9.9 Example Transactions
- 9.10 Conclusion
Chapter 10: Dashboards
- 10.1 Sample Service
- 10.2 Sample Dashboards
- 10.3 Master Dashboard
- 10.4 Per-Instance Dashboards
- 10.5 Per-Server Dashboards
- 10.6 Sanity Checks
- 10.7 Summary
- Exercises
Chapter 11: Other Existing Tools
- 11.1 Kinds of Observation Tools
- 11.2 Data to Observe
- 11.3 top Command
- 11.4 /proc and /sys Pseudofiles
- 11.5 time Command
- 11.6 perf Command
- 11.7 oprofile, CPU Profiler
- 11.8 strace, System Calls
- 11.9 ltrace, CPU C Library Calls
- 11.10 ftrace, CPU Trace
- 11.11 mtrace, Memory Malloc/Free
- 11.12 blktrace, Disk Trace
- 11.13 tcpdump and Wireshark, Network Trace
- 11.14 locktrace, Critical Section Locks
- 11.15 Offered Load, Outbound Calls, and Transaction Latency
- 11.16 Summary
- Exercises
Chapter 12: Traces
- 12.1 Tracing Advantages
- 12.2 Tracing Disadvantages
- 12.3 The Three Starting Questions
- 12.4 Example: Early Program Counter Trace
- 12.5 Example: Per-Function Counts and Time
- 12.6 Case Study: Per-Function Trace of Gmail
- 12.7 Summary
Chapter 13: Observation Tool Design Principles
- 13.1 What to Observe
- 13.2 How Frequently and For How Long?
- 13.3 How Much Overhead?
- 13.4 Design Consequences
- 13.5 Case Study: Histogram Buckets
- 13.6 Designing Data Display
- 13.7 Summary
Part III: Kernel-User Trace
Chapter 14: KUtrace: Goals, Design, Implementation
- 14.1 Overview
- 14.2 Goals
- 14.3 Design
- 14.4 Implementation
- 14.5 Kernel Patches and Module
- 14.6 Control Program
- 14.7 Postprocessing
- 14.8 A Note on Security
- 14.9 Summary
Chapter 15: KUtrace: Linux Kernel Patches
- 15.1 Trace Buffer Data Structures
- 15.2 Raw Traceblock Format
- 15.3 Trace Entries
- 15.4 IPC Trace Entries
- 15.5 Timestamps
- 15.6 Event Numbers
- 15.7 Nested Trace Entries
- 15.8 Code
- 15.9 Packet Tracing
- 15.10 AMD/Intel x86-64 Patches
- 15.11 Summary
- Exercises
Chapter 16: KUtrace: Linux Loadable Module
- 16.1 Kernel Interface Data Structures
- 16.2 Module Load/Unload
- 16.3 Initializing and Controlling Tracing
- 16.4 Implementing Trace Calls
- 16.5 Insert1
- 16.6 InsertN
- 16.7 Switching to a New Traceblock
- 16.8 Summary
Chapter 17: KUtrace: User-Mode Runtime Control
- 17.1 Controlling Tracing
- 17.2 Standalone kutrace_control Program
- 17.3 The Underlying kutrace_lib Library
- 17.4 The Control Interface to the Loadable Module
- 17.5 Summary
Chapter 18: KUtrace: Postprocessing
- 18.1 Postprocessing Details
- 18.2 The rawtoevent Program
- 18.3 The eventtospan Program
- 18.4 The spantotrim Program
- 18.5 The spantospan Program
- 18.6 The samptoname_k and samptoname_u Programs
- 18.7 The makeself Program
- 18.8 KUtrace JSON Format
- 18.9 Summary
Chapter 19: KUtrace: Display of Software Dynamics
- 19.1 Overview
- 19.2 Region 1, Controls
- 19.3 Region 2, Y-axis
- 19.4 Region 3, Timelines
- 19.5 Region 4, IPC Legend
- 19.6 Region 5, X-axis
- 19.7 Region 6, Save/Restore
- 19.8 Secondary Controls
- 19.9 Summary
Part IV: Reasoning
Chapter 20: What to Look For
- 20.1 Overview
Chapter 21: Executing Too Much
- 21.1 Overview
- 21.2 The Program
- 21.3 The Mystery
- 21.4 Exploring and Reasoning
- 21.5 Mystery Understood
- 21.6 Summary
Chapter 22: Executing Slowly
- 22.1 Overview
- 22.2 The Program
- 22.3 The Mystery
- 22.4 Floating-Point Antagonist
- 22.5 Memory Antagonist
- 22.6 Mystery Understood
- 22.7 Summary
Chapter 23: Waiting for CPU
- 23.1 The Program
- 23.2 The Mystery
- 23.3 Exploring and Reasoning
- 23.4 Mystery 2
- 23.5 Mystery 2 Understood
- 23.6 Bonus Mystery
- 23.7 Summary
Chapter 24: Waiting for Memory
- 24.1 The Program
- 24.2 The Mystery
- 24.3 Exploring and Reasoning
- 24.4 Mystery 2: Access to a Page Table
- 24.5 Mystery 2 Understood
- 24.6 Summary
- Exercises
Chapter 25: Waiting for Disk
- 25.1 The Program
- 25.2 The Mystery
- 25.3 Exploring and Reasoning
- 25.4 Reading 40MB
- 25.5 Reading Sequential 4KB Blocks
- 25.6 Reading Random 4KB Blocks
- 25.7 Writing and Sync of 40MB on SSD
- 25.8 Reading 40MB on SSD
- 25.9 Two Programs Accessing Two Files at Once
- 25.10 Mysteries Understood
- 25.11 Summary
- Exercises
Chapter 26: Waiting for Network
- 26.1 Overview
- 26.2 The Programs
- 26.3 Experiment 1
- 26.4 Experiment 1 Mystery
- 26.5 Experiment 1 Exploring and Reasoning
- 26.6 Experiment 1 What About the Time Between RPCs?
- 26.7 Experiment 2
- 26.8 Experiment 3
- 26.9 Experiment 4
- 26.10 Mysteries Understood
- 26.11 Bonus Anomaly
- 26.12 Summary
Chapter 27: Waiting for Locks
- 27.1 Overview
- 27.2 The Program
- 27.3 Experiment 1: Long Lock Hold Times
- 27.4 Mysteries in Experiment 1
- 27.5 Exploring and Reasoning in Experiment 1
- 27.6 Experiment 2: Fixing Lock Capture
- 27.7 Experiment 3: Fixing Lock Contention via Multiple Locks
- 27.8 Experiment 4: Fixing Lock Contention via Less Locked Work
- 27.9 Experiment 5: Fixing Lock Contention via RCPU for Dashboard
- 27.10 Summary
Chapter 28: Waiting for Time
- 28.1 Periodic Work
- 28.2 Timeouts
- 28.3 Timeslicing
- 28.4 Inline Execution Delays
- 28.5 Summary
Chapter 29: Waiting for Queues
- 29.1 Overview
- 29.2 Request Distribution
- 29.3 Queue Structure
- 29.4 Worker Tasks
- 29.5 Primary Task
- 29.6 Dequeue
- 29.7 Enqueue
- 29.8 Spinlock
- 29.9 The “Work” Routine
- 29.10 Simple Examples
- 29.11 What Could Possibly Go Wrong?
- 29.12 CPU Frequency
- 29.13 Complex Examples
- 29.14 Waiting for CPUs: RPC Log
- 29.15 Waiting for CPUs: KUtrace
- 29.16 PlainSpinLock Flaw
- 29.17 Root Cause
- 29.18 PlainSpinLock Fixed: Observability
- 29.19 Load Balancing
- 29.20 Queue Depth: Observability
- 29.21 Spin at the End
- 29.22 One More Flaw
- 29.23 Cross-Checking
- 29.24 Summary
- Exercises
Chapter 30: Recap
- 30.1 What You Learned
- 30.2 What We Haven’t Covered
- 30.3 Next Steps
- 30.4 Summary (for the Entire Book)
People also search for Understanding Software Dynamics 1st:
understanding software dynamics pdf github
what is dynamics software
how to understand dynamics
microsoft dynamics explained
system dynamics review
Tags:
Richard Sites,Understanding,Software,Dynamics 1st
You may also like…
Computers - Networking
Computers - Web Development
Business & Economics - Management & Leadership


